Welcome to Excel Avon
Human KPI Chart in Excel
DOWNLOAD USED EXCEL FILE FROM HERE>>
In today’s post we will show you How to Create Human KPI Chart in Excel, although it is quite simple, only Stalked chart will be used in this, so it is going to be very easy. Human KPI charts is very attractive and innovative in Excel. In charts, we represent data points with the help of Human shapes. KPIs are represented by scale segments of a scale, and the position of each KPI is shown by a human body within the chart. This article will show you how to create a Human KPI chart in Excel.
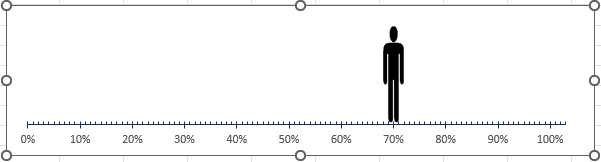
By the way, our Balloon Chart is going to be like this as you can see.
Create Human KPI Chart in Excel
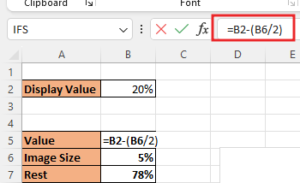
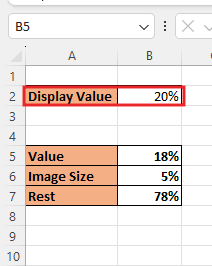
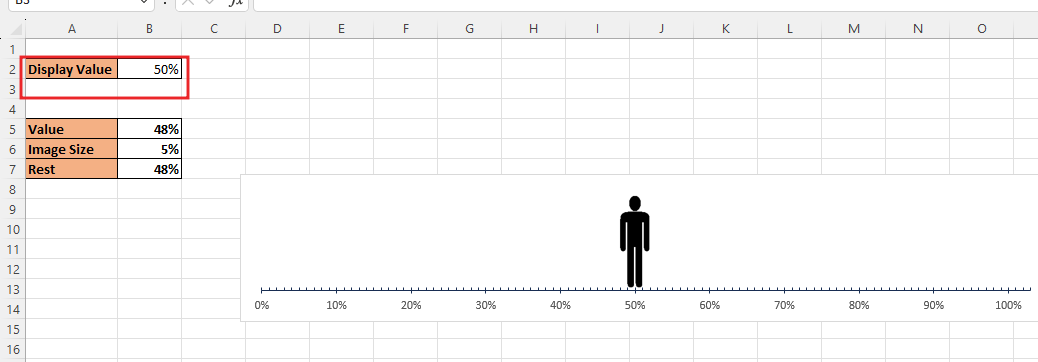
Create a table in excel sheet which will look something like this. In which there will be 3, value% Image Size and Rest value. Added formula for Value cell. =B2(B6/2). If you have more data, then you can create for that also.
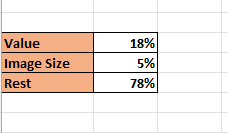
Along with this, we have added the formula in the rest part, as you can see in the image, by adding the value cell and image size cell, it has been Subtract to 100.
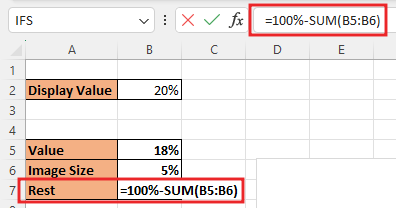
Along with this, another cell has been added which will see the display value.
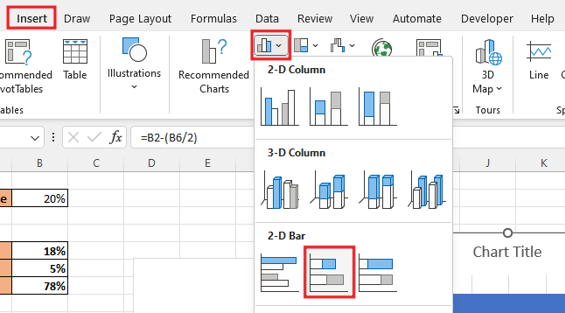
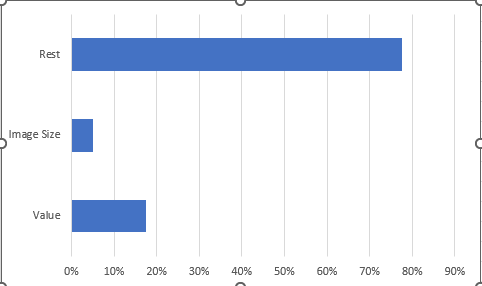
Now Select the data, go to the Insert, from here Go to Line and Are chart. Here we will insert stacked charts, in stacked charts data series are stacked over one another for particular axes. Select data> Insert tab> 2-D Bar > Stalked Chart.
To Remove the legend at the bottom, select the legend and delete it. If you are working in a project or making a chart for the project, then you can write the name of that project in the title of the chart.
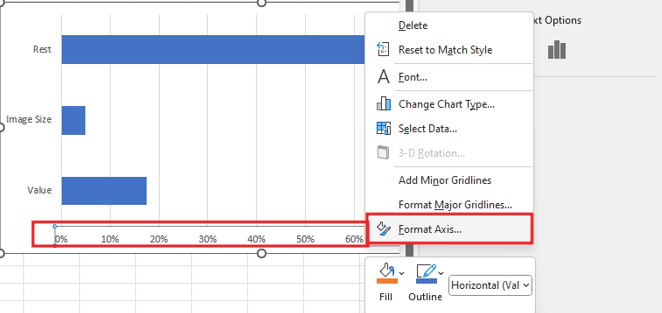
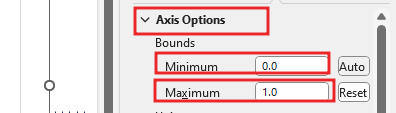
Now select the axis of the chart and right click and then go to Format Axis option.
In the Bounds section of the Axis option, put 0 in the Minimum Bound and 1 in the Maximum Bound fill. So that the chart will be full size, and the scale of the axis will be 100.
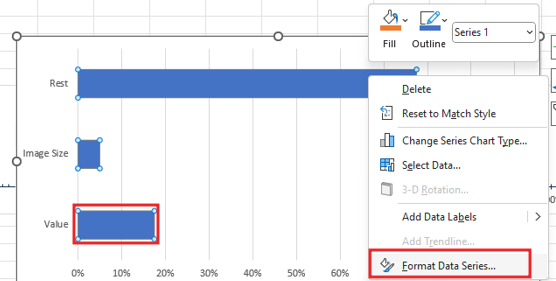
Right click on Bars and then click on Format Data Series option.
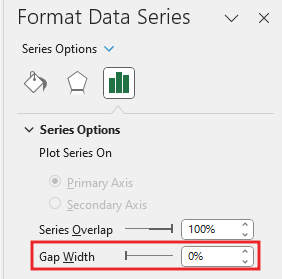
From data series we’ll Reduce the width of the bar gap.
Once again right click on the chart and then click on select data option.
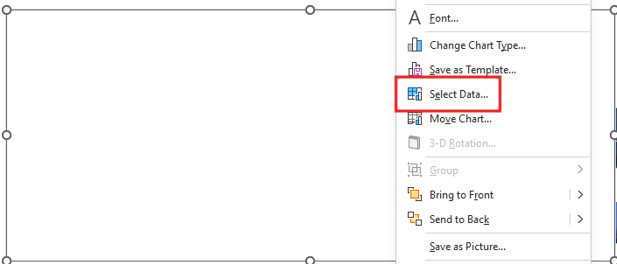
Click on the Select Data option and click on the Switch Row/Column button.

Now we will fit the chart in the sheet properly.
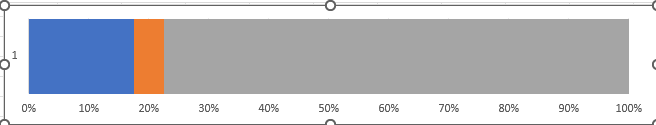
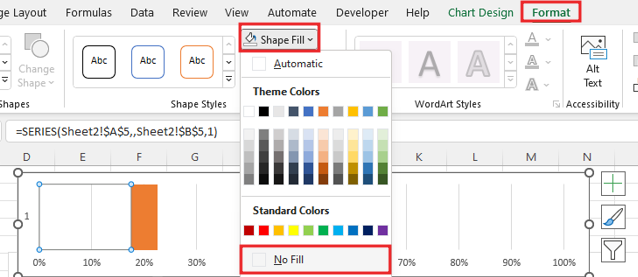
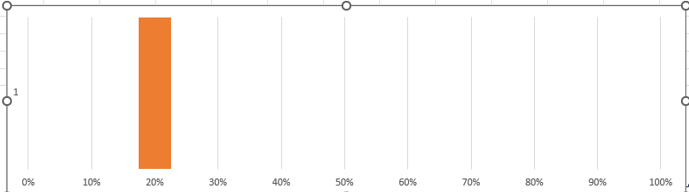
Do color formatting of the bars of the chart by going to the format option, No fill the part of gray and blue color.
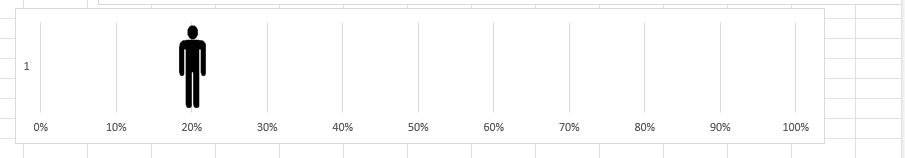
After formatting our human KPI chart will look like this.
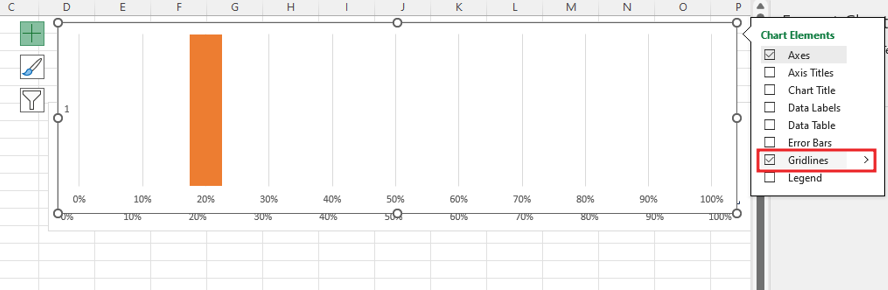
Unselect the gridline of the chart by going to the chart elements, which will remove the gridline of the chart.
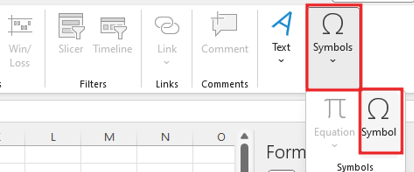
Now you will insert a new sheet and insert a shape in it. First of all, go to insert tab then go to symbols> Symbol.
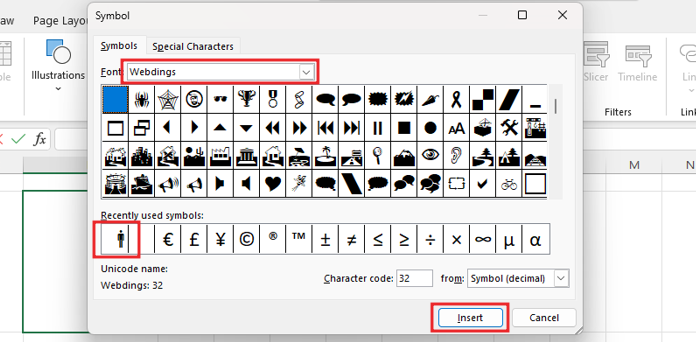
Go to Font Dropdown and write webdings, here you select human shape and click insert button.
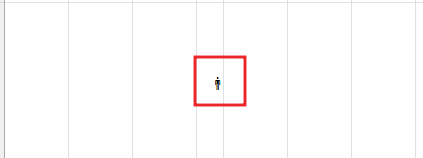
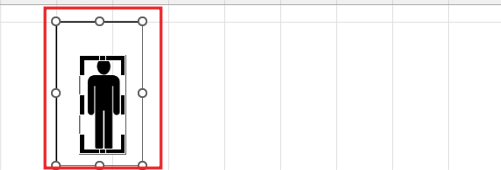
When the human shape will be inserted in the cell, now you will be formatting the shape.
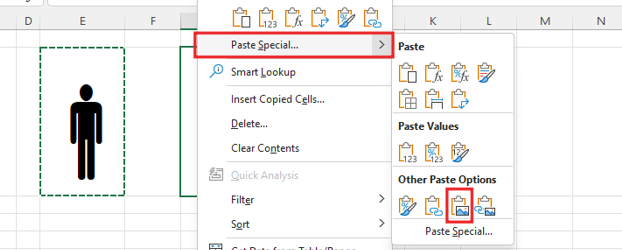
Now copy the Shape and paste as picture by right click.
Now you will crop in picture format.
Cropping the shape, copying and pasting it in sheet 1, selecting the orange part and then pasting.
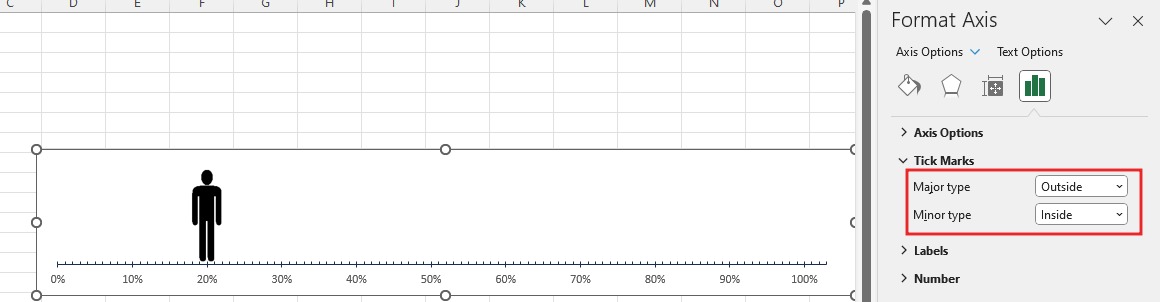
Now add tick mark to the scale and make the major type outside and the minor type inside.
Now you can shift the chart human size to the right place in the scale after changing the value of the display cell.
Therefore, I hope that you have understood How to Create Human KPI Chart in Excel, maybe if you do not understand anything, then you can comment us with the question, which we will answer soon and for more information, you can follow us on Twitter, Instagram, LinkedIn and you can also follow on YouTube.
DOWNLOAD USED EXCEL FILE FROM HERE>>
LEARN MORE DASHBORAD AND CHART TOPIC HERE
You can also see well-explained video here about How to Create Human KPI Chart in Excel


