Welcome to Excel Avon
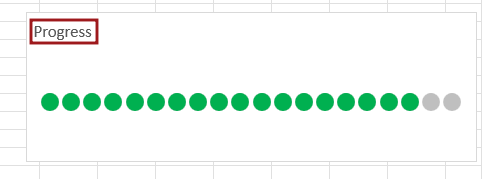
Dot Progress chart in Excel
DOWNLOAD THE USED EXCEL FILE FROM HERE>>
In today’s post we will explain How to create Dot Progress chart in Excel, The dot progress chart is a ‘Fancy’ version of the bar chart. This will be created with the help of line chart. In the excel there is No default option to create a Dot progress chart Tracking how much of the planned activity, progress, revenue, sales or goals have been completed is a crucial task in any project. There are a lot of different chart types we can use to visualize progress toward a goal. So today in this article, I will explain how to create Dot Progress Chart in Excel step by step with pictures.

Create Dot Progress chart in Excel
Create a table in excel sheet which will look something like this. In which there will be 3 row, Serial No., grey and color. In the gray cell we added 1. There is no formula added here.
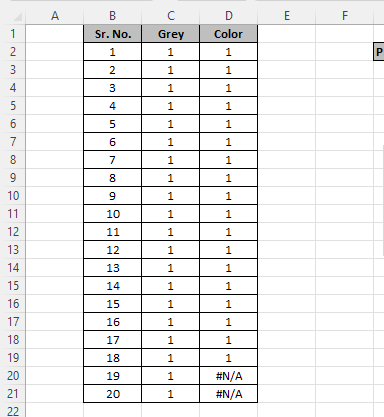
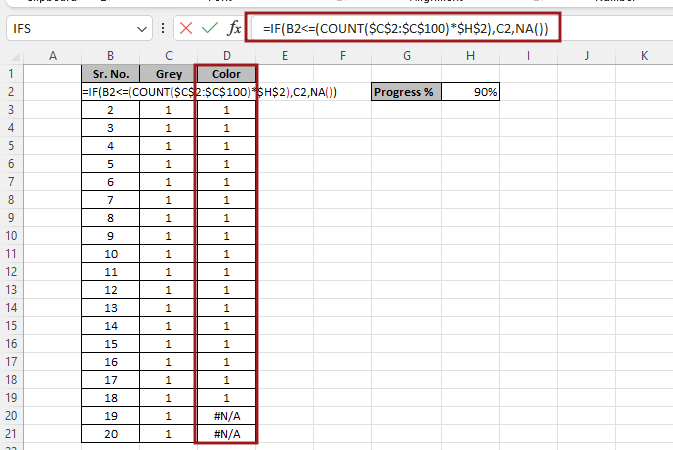
We added a formula in the color cell which is something like this. If the value of B2 is less than or equal to the range C2:C100 the condition is true then value of C2is returned otherwise NA. After Added formula drag pick the corner of D2 and drag it down. =IF(B2<=(COUNT($C$2:$C$100)*$H$2),C2,NA())
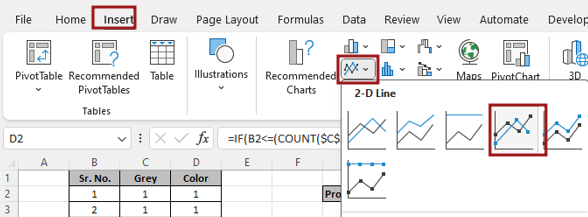
Go to Insert tab and click on insert Line chart. insert line with marker graph.
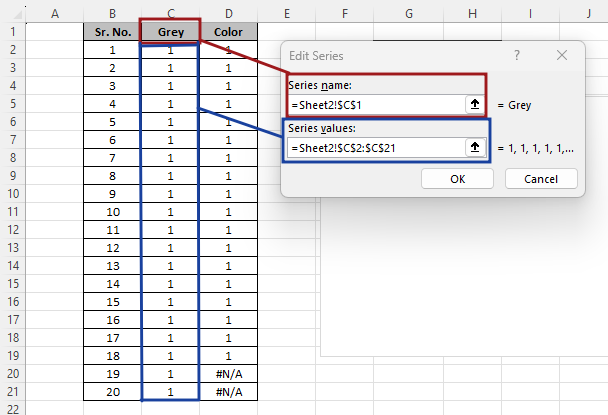
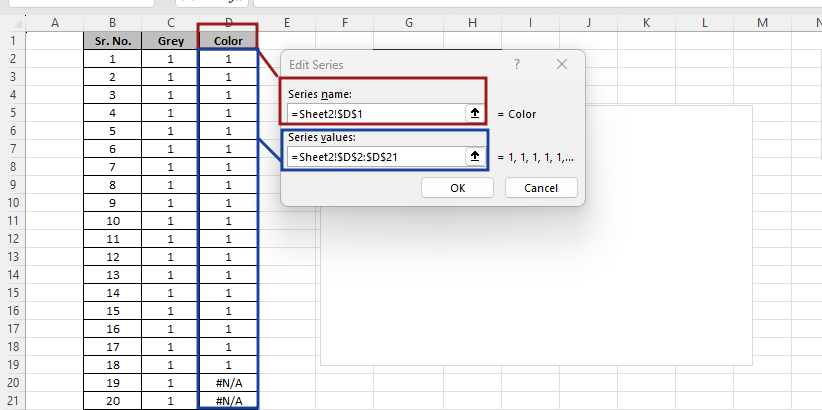
There is no data in the chart after the chart is inserted, so now we will go to select data by right clicking.

From select data, we will click on add button and then write series name and series value here, name the series as grey, then select the gray Column cell for the series value.
Now add another data series in which series name will give the range of Color cell then select the range of Color Column range for series value.
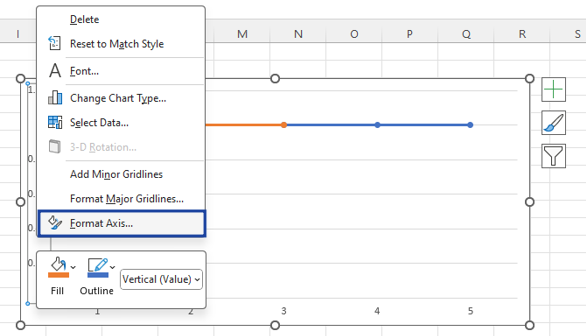
Now we will do the formatting of the series by right clicking on the axis.
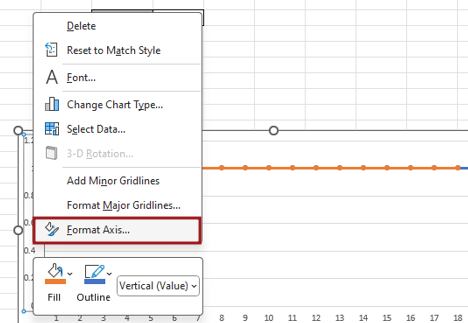
Now we will do the formatting of the series by right clicking on the axis.
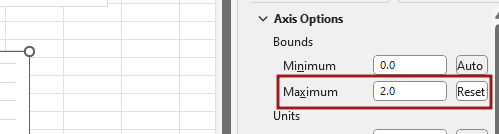
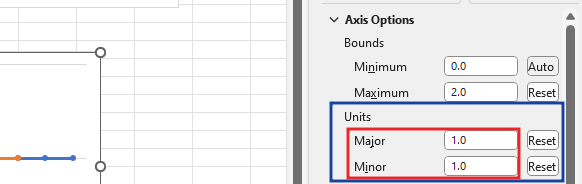
Now we will change the bound value of the axis. Now here we will change the max bound from 1.2 to 2.
Now after we change the bound value of axis, we will change major type to 1 and minor type to 1 in units.
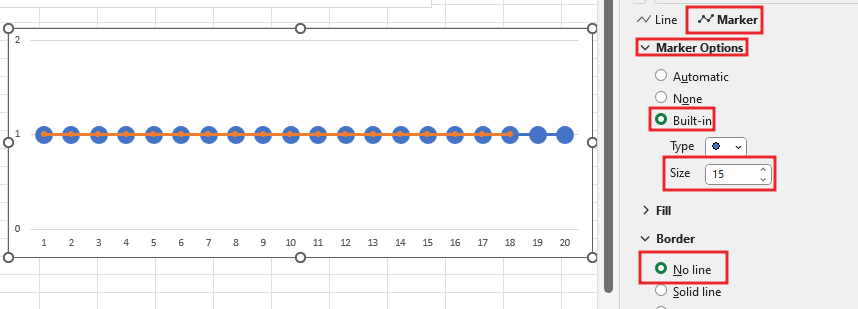
Formatting of marker representing gray data in chart will be done by going to marker option, change the type of marker to built-in type option and increase all the markers size to 15. And fill No line for the border of the marker.
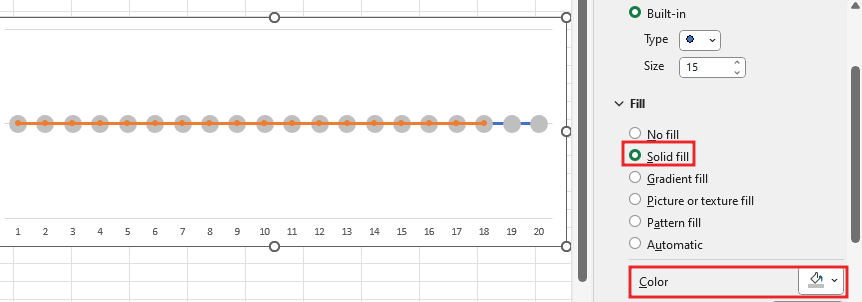
We will add color to the marker as per our requirement. We are fill grey color for grey marker.
As you added two types of data, one for gray and one called Color series, now you will format the marker representing the Color series.
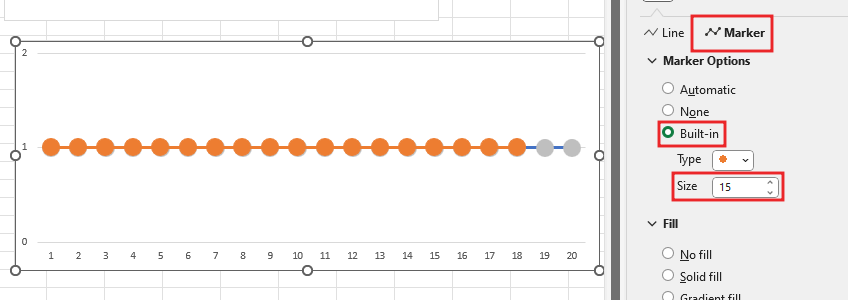
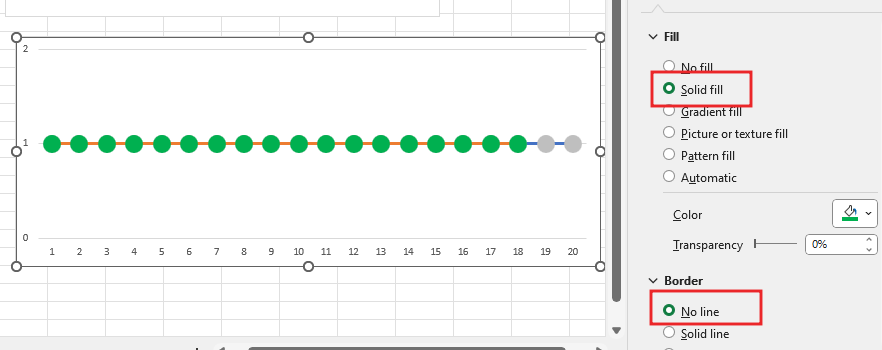
We will add color for Color Marker. And fill No line for the border of the marker.
 ,
,
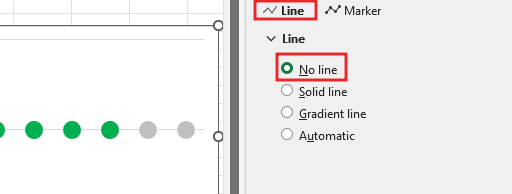
As we had increased its thickness in the step progress chart, we will hide it by making no line in the dot chart and you will have to remove the line of both the data i.e. gray marker and color data marker.
Remove gridlines and axis element in the chart.
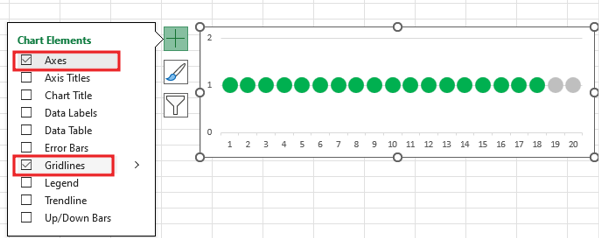
After removing the gridlines and axes from the chart, we have to add a title to the chart.
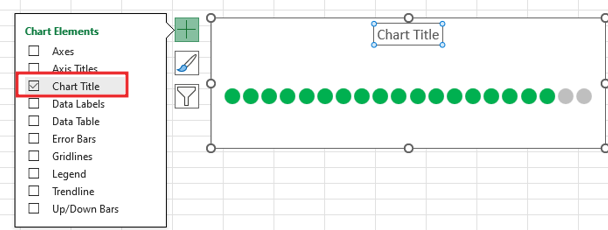
After adding the chart title, we name the charts as you want.
To add a text box to the chart, go to the Insert tab and then drag the text box.

Now add the formula in the textbox =Sheet2!$H$2
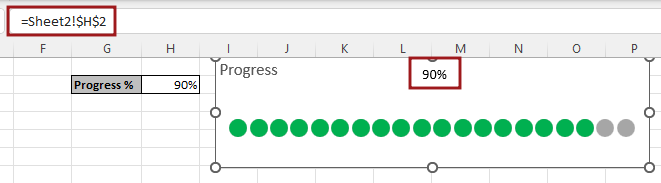
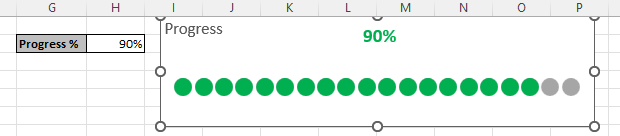
After Adding the formula when value is print in Textbox, aligning the text box. Customize text box, Bold, size of font color, size of font.
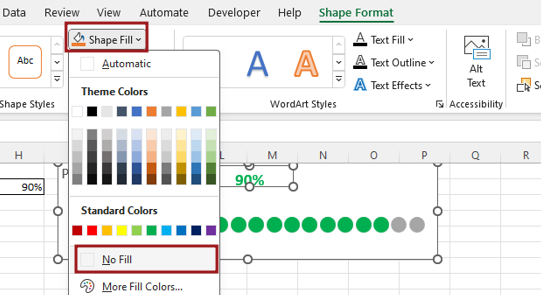
Select the text box and go to shape format option then Make text box no fill and No outline.
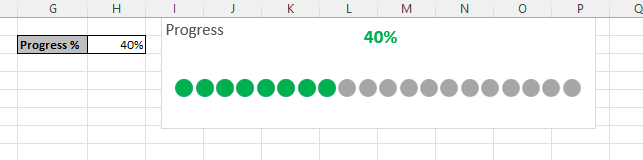
Now our Dot progress in Excel. change the value of progress cell then you can see chart has been changed.
Therefore, I hope that you have understood How to Create Dot progress Chart in Excel, maybe if you do not understand anything, then you can comment us with the question, which we will answer soon and for more information, you can follow us on Twitter, Instagram, LinkedIn and you can also follow on YouTube.
DOWNLOAD THE USED EXCEL FILE FROM HERE>>
LEARN MORE DASHBORAD AND CHART TOPIC HERE
You can also see well-explained video here about How to Create Dot progress Chart in Excel


