Welcome to Excel Avon
Custom Column chart in Excel
DOWNLOAD THE USED EXCEL FILE FROM HERE>>
In today’s post we will explain how to create a custom column chart in Excel. As I explained to you, to create a column chart in Excel we have to use a 2-D bar chart (stacked chart) because stacked charts are also called column charts. Column chart in Excel compares data values from different ranges and presents them graphically in the form of a chart.
It shows sequential changes in data over time as vertical columns, so that we can compare or visualize data changes. They are different types of column charts in 2D and 3D, such as clustered column and stacked column.
So today in this article, I will explain How to create custom column chart in excel step by step with pictures.
Well, as you can see, our custom column chart to be like this.

Create Custom Column chart in Excel
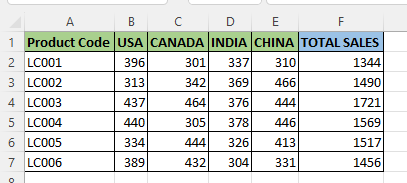
For example, we have taken the data of product sales in 4 countries, which includes product code, then quantity sold and then total sales, for this data we have to create a column chart.

Select the range of cells A1:E7. Ignore the total column cell. We have included row 1 in our selection. Because we need data columns along with their label names.

Now you have to insert a chart for this selected data, then you Click Insert tab > Insert Column or Bar Chart > Stacked Columns.

After inserting the chart, you can make some changes in it like changing the title of this chart, if you do not want to keep it then you can also delete it.

Now customize the columns showing the data in this chart as per your requirement, like fill all their colors in such a way that they look professional. For this you have to select the column parts one by one and go to the Format tab and change the color from the fill option.

Now we will go to Select data by right clicking.

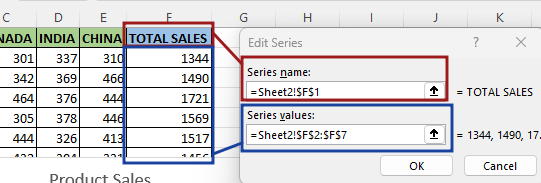
From select data, we will click on add button and then write Series name and series value here, name the series as Total sales Cell, then select the Total sales Column for the series value.

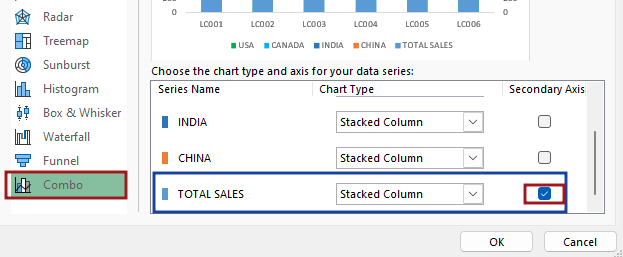
Now after selecting the chart, go to the chart design option and then go to the chart type. In the chart type, you will see the types of charts inserted for all the data. From the chart type, you go to combo option and then total sales will be the secondary axis.


Right click on the chart and go to Formatting Data Series option.

Now select the column and now you decrease the gap width value of each axis. it reduces that column gap width.

Now you can see and understand that we are formatting the secondary axis like now go to the fill option and do solid fill and then select the color and then make the transparency of the secondary axis 70%.

Now we will do the formatting for the border, go to the border option and make a solid line and then select the color and then increase the width of the secondary axis border.

Now we will remove total Sales Legend.

We will remove some elements from the chart like the gridline, axis and along with this we will add data labels to the columns.

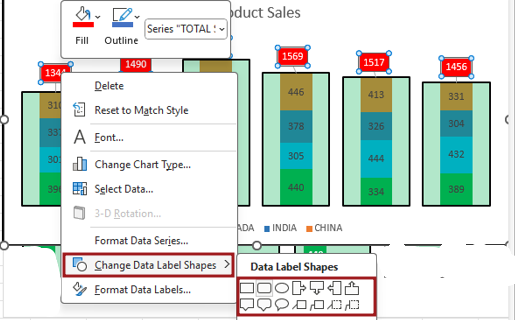
After adding the data label, there is a label for total sales, and we’ll fit it at the right place. right click on total sales labels then you change the shape of labels and then do formatting total sales labels like bold color background color.

Now you have to format the primary axis.

After working out the overlap value of the series of primary axis, our chart is ready. You can see it like this, our custom column chart.

Therefore, I hope that you have understood How to Create Custom column chart in Excel, maybe if you do not understand anything, then you can comment us with the question, which we will answer soon and for more information, you can follow us on Twitter, Instagram, LinkedIn and you can also follow on YouTube.
DOWNLOAD THE USED EXCEL FILE FROM HERE>>
LEARN MORE DASHBORAD AND CHART TOPIC HERE
You can also see well-explained video here about How to Create Custom column Chart in Excel


