Welcome to Excel Avon
What is add Sparkline in Excel
This topic is For add sparkline in excel. Sparklines were first introduced in the version of Excel 2010. This feature was introduced to represent data in any smaller form of charts without any axes and coordinates. Sparklines can be easily embedded in a cell, and they are commonly used to show trends or variations in numbers entered in your sheet. There are three types of sparklines in Excel that can be used for different examples.
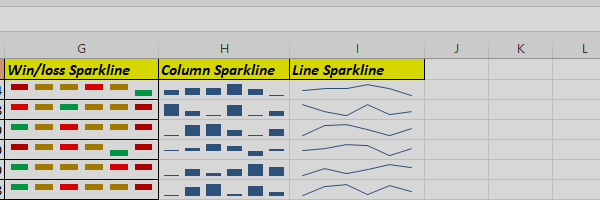
- Line : This sparkline has a simple line chart similar to a normal line chart, but without the magnitude and axes.
- Column : A column sparkline is a column chart that represents values by showing the magnitude along with it.
- Win/Loss : It represents the output either positively or negatively, which helps the user to compare the results.
How to use Sparkline in Excel
DOWNLOAD USED EXCEL FILE FROM HERE>>
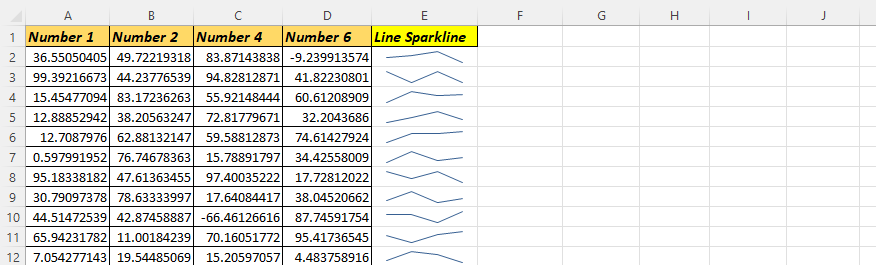
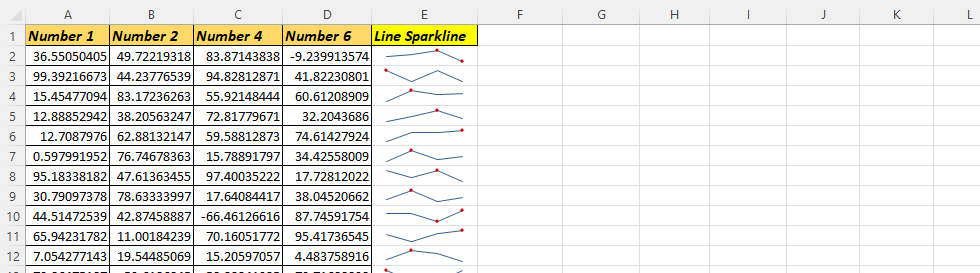
Now we will first create the data sheet and add sparkline to the table here there are 6 columns where the data is given and will follow some steps
Select the empty cell where you wish to add sparkline,

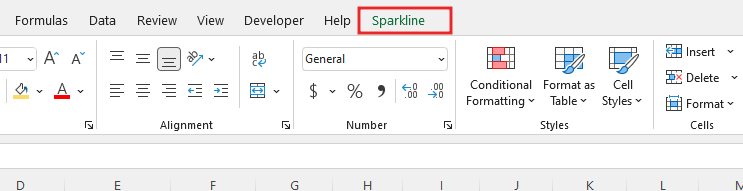
Click on the Insert tab, Select the Line option from the Sparklines menu appearing on the toolbar.

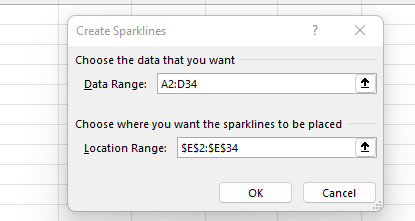
After selecting the Line option, a Create Sparkline dialog box will appear. In which we need to enter the data range in the Data Range box. In this example, we have selected the data range as A2:D34, and in the Location Range box, you don’t have to enter it as it fills it automatically after you select the empty cell for your sparkline to be inserted. After that, Click OK.
Now Sparkline has been added.
Now we will mark the point go to the sparkly design to mark the point.
After going to the sparkline option, we can see here that you will get some features which can mark points.
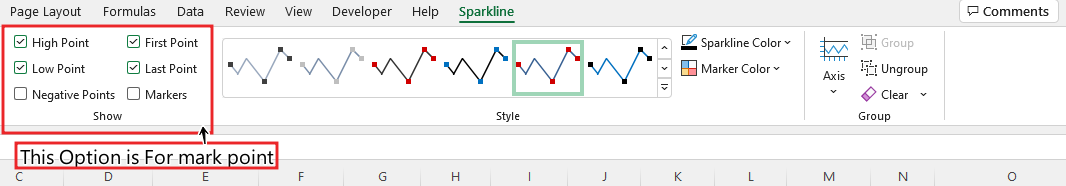
If we mark some points like high and negative point, then we will get some such data which is marking the line, some limit has to be given to mark the negative point, in which if the value of the cell is below the limit then negative line in negative can be marked
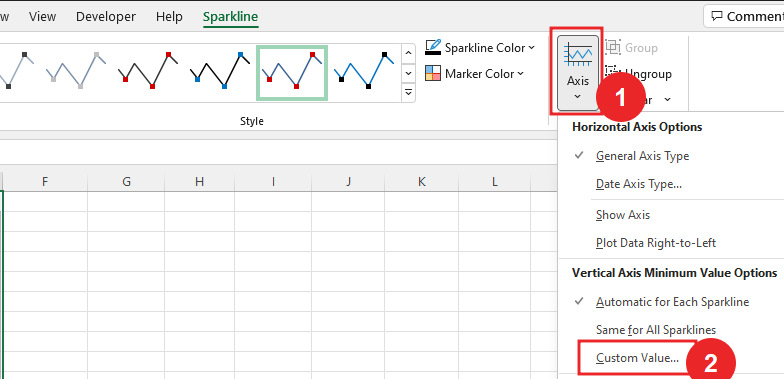
You can go to Axis and add its maximum and minimum value. You can go to the axis and add its maximum and minimum value, a pop up window will open for the minimum value below, in which you can fill the minimum value. We have filled the minimum value as 0 and maximum value 100.
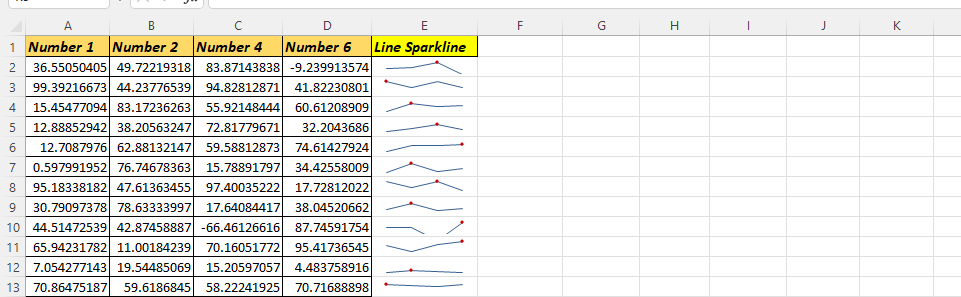
After filling the minimum and maximum values, the sparkline will become something like this and you can also see the marker.
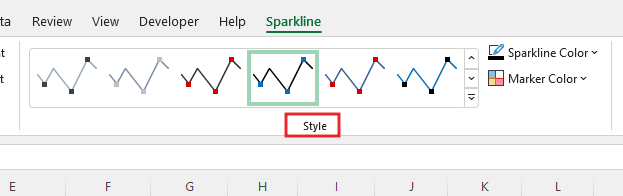
Now I change the style of the sparkline, let’s go to the sparkline for this and you can select the style from you, you can see two buttons next to the sparkline, the sparkline color, whose line color and marker color can change the color of the mark marker.
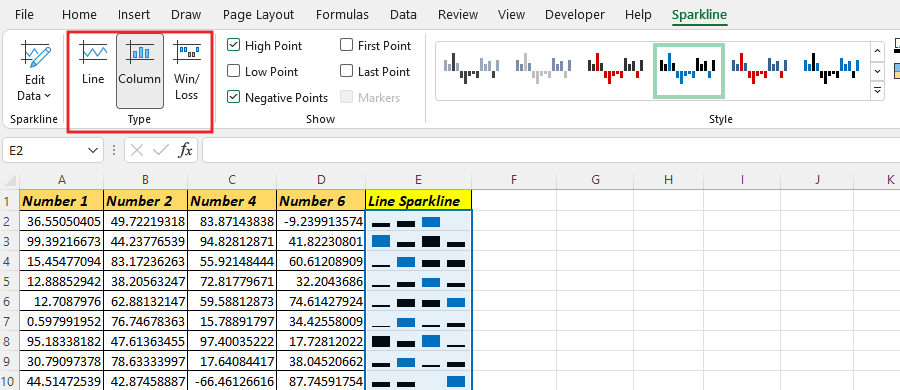
You can change the add sparkline type by going to the type option, here there are 3 types Line, Column and Win/Loss.
-
- When you are making any changes in Sparkline, then you have to do it by selecting the Sparkline column.
DOWNLOAD USED EXCEL FILE FROM HERE>>
So I hope you have understood How to add Sparkline in Excel and for more information, you can follow us on Twitter, Instagram, LinkedIn, and YouTube as well.
You can also see well-explained video here
hQ
")
